
Launch Sites Locations Analysis with Folium
Estimated time needed: 40 minutes
The launch success rate may depend on many factors such as payload mass, orbit type, and so on. It may also depend on the location and proximities of a launch site, i.e., the initial position of rocket trajectories. Finding an optimal location for building a launch site certainly involves many factors and hopefully we could discover some of the factors by analyzing the existing launch site locations.
In the previous exploratory data analysis labs, you have visualized the SpaceX launch dataset using matplotlib and seaborn and discovered some preliminary correlations between the launch site and success rates. In this lab, you will be performing more interactive visual analytics using Folium.
Objectives
This lab contains the following tasks:
- TASK 1: Mark all launch sites on a map
- TASK 2: Mark the success/failed launches for each site on the map
- TASK 3: Calculate the distances between a launch site to its proximities
After completed the above tasks, you should be able to find some geographical patterns about launch sites.
Let’s first import required Python packages for this lab:
!pip3 install folium
!pip3 install wget
Requirement already satisfied: folium in /Library/Frameworks/Python.framework/Versions/3.11/lib/python3.11/site-packages (0.13.0)
Requirement already satisfied: branca>=0.3.0 in /Library/Frameworks/Python.framework/Versions/3.11/lib/python3.11/site-packages (from folium) (0.5.0)
Requirement already satisfied: jinja2>=2.9 in /Library/Frameworks/Python.framework/Versions/3.11/lib/python3.11/site-packages (from folium) (3.1.2)
Requirement already satisfied: numpy in /Library/Frameworks/Python.framework/Versions/3.11/lib/python3.11/site-packages (from folium) (1.23.4)
Requirement already satisfied: requests in /Library/Frameworks/Python.framework/Versions/3.11/lib/python3.11/site-packages (from folium) (2.28.1)
Requirement already satisfied: MarkupSafe>=2.0 in /Library/Frameworks/Python.framework/Versions/3.11/lib/python3.11/site-packages (from jinja2>=2.9->folium) (2.1.1)
Requirement already satisfied: charset-normalizer<3,>=2 in /Library/Frameworks/Python.framework/Versions/3.11/lib/python3.11/site-packages (from requests->folium) (2.1.1)
Requirement already satisfied: idna<4,>=2.5 in /Library/Frameworks/Python.framework/Versions/3.11/lib/python3.11/site-packages (from requests->folium) (3.4)
Requirement already satisfied: urllib3<1.27,>=1.21.1 in /Library/Frameworks/Python.framework/Versions/3.11/lib/python3.11/site-packages (from requests->folium) (1.26.12)
Requirement already satisfied: certifi>=2017.4.17 in /Library/Frameworks/Python.framework/Versions/3.11/lib/python3.11/site-packages (from requests->folium) (2022.9.24)
[1m[[0m[34;49mnotice[0m[1;39;49m][0m[39;49m A new release of pip available: [0m[31;49m22.3[0m[39;49m -> [0m[32;49m22.3.1[0m
[1m[[0m[34;49mnotice[0m[1;39;49m][0m[39;49m To update, run: [0m[32;49mpip install --upgrade pip[0m
Requirement already satisfied: wget in /Library/Frameworks/Python.framework/Versions/3.11/lib/python3.11/site-packages (3.2)
[1m[[0m[34;49mnotice[0m[1;39;49m][0m[39;49m A new release of pip available: [0m[31;49m22.3[0m[39;49m -> [0m[32;49m22.3.1[0m
[1m[[0m[34;49mnotice[0m[1;39;49m][0m[39;49m To update, run: [0m[32;49mpip install --upgrade pip[0m
import folium
import wget
import pandas as pd
# Import folium MarkerCluster plugin
from folium.plugins import MarkerCluster
# Import folium MousePosition plugin
from folium.plugins import MousePosition
# Import folium DivIcon plugin
from folium.features import DivIcon
If you need to refresh your memory about folium, you may download and refer to this previous folium lab:
Task 1: Mark all launch sites on a map
First, let’s try to add each site’s location on a map using site’s latitude and longitude coordinates
The following dataset with the name spacex_launch_geo.csv is an augmented dataset with latitude and longitude added for each site.
# Download and read the `spacex_launch_geo.csv`
spacex_df=pd.read_csv('spacex_launch_geo.csv')
# Select relevant sub-columns: `Launch Site`, `Lat(Latitude)`, `Long(Longitude)`, `class`
spacex_df = spacex_df[['Launch Site', 'Lat', 'Long', 'class']]
launch_sites_df = spacex_df.groupby(['Launch Site'], as_index=False).first()
launch_sites_df = launch_sites_df[['Launch Site', 'Lat', 'Long']]
launch_sites_df.head()
| Launch Site | Lat | Long | |
|---|---|---|---|
| 0 | CCAFS LC-40 | 28.562302 | -80.577356 |
| 1 | CCAFS SLC-40 | 28.563197 | -80.576820 |
| 2 | KSC LC-39A | 28.573255 | -80.646895 |
| 3 | VAFB SLC-4E | 34.632834 | -120.610745 |
Now, you can take a look at what are the coordinates for each site.
spacex_df=pd.read_csv('dataset_part_2.csv')
spacex_df.head()

# Select relevant sub-columns: `Launch Site`, `Lat(Latitude)`, `Long(Longitude)`, `class`
spacex_df = spacex_df[['LaunchSite', 'Latitude', 'Longitude', 'Class']]
launch_sites_df = spacex_df.groupby(['LaunchSite'], as_index=False).first()
launch_sites_df = launch_sites_df[['LaunchSite', 'Latitude', 'Longitude']]
launch_sites_df.head()
| LaunchSite | Latitude | Longitude | |
|---|---|---|---|
| 0 | CCSFS SLC 40 | 28.561857 | -80.577366 |
| 1 | KSC LC 39A | 28.608058 | -80.603956 |
| 2 | VAFB SLC 4E | 34.632093 | -120.610829 |
Above coordinates are just plain numbers that can not give you any intuitive insights about where are those launch sites. If you are very good at geography, you can interpret those numbers directly in your mind. If not, that’s fine too. Let’s visualize those locations by pinning them on a map.
We first need to create a folium Map object, with an initial center location to be NASA Johnson Space Center at Houston, Texas.
# Start location is NASA Johnson Space Center
nasa_coordinate = [29.559684888503615, -95.0830971930759]
site_map = folium.Map(location=nasa_coordinate, zoom_start=10)
We could use folium.Circle to add a highlighted circle area with a text label on a specific coordinate. For example,
# Create a blue circle at NASA Johnson Space Center's coordinate with a popup label showing its name
circle = folium.Circle(nasa_coordinate, radius=1000, color='#d35400', fill=True).add_child(folium.Popup('NASA Johnson Space Center'))
# Create a blue circle at NASA Johnson Space Center's coordinate with a icon showing its name
marker = folium.map.Marker(
    nasa_coordinate,
    # Create an icon as a text label
    icon=DivIcon(
        icon_size=(20,20),
        icon_anchor=(0,0),
        html='<div style="font-size: 12; color:#d35400;"><b>%s</b></div>' % 'NASA JSC',
        )
    )
site_map.add_child(circle)
site_map.add_child(marker)
and you should find a small yellow circle near the city of Houston and you can zoom-in to see a larger circle.
Now, let’s add a circle for each launch site in data frame launch_sites
TODO: Create and add folium.Circle and folium.Marker for each launch site on the site map
An example of folium.Circle:
folium.Circle(coordinate, radius=1000, color='#000000', fill=True).add_child(folium.Popup(...))
An example of folium.Marker:
folium.map.Marker(coordinate, icon=DivIcon(icon_size=(20,20),icon_anchor=(0,0), html='<div style="font-size: 12; color:#d35400;"><b>%s</b></div>' % 'label', ))
# Initial the map
site_map = folium.Map(location=nasa_coordinate, zoom_start=5)
# For each launch site, add a Circle object based on its coordinate (Lat, Long) values. In addition, add Launch site name as a popup label
for index, row in launch_sites_df.iterrows():
    coordinate = [row["Latitude"], row["Longitude"]]#coordinate = [row["Lat"], row["Long"]]
    launchSite = row["LaunchSite"]#launchSite = row["Launch Site"]
    circle = folium.Circle(coordinate, radius=1000, color='#d35400', fill=True).add_child(folium.Popup(launchSite)).add_to(site_map)
    marker = folium.map.Marker(
    coordinate,
    # Create an icon as a text label
    icon=DivIcon(
        icon_size=(20,20),
        icon_anchor=(0,0),html='<div style="font-size: 12; color:#d35400;"><b>%s</b></div>' % launchSite,
        )
    ).add_to(site_map)

site_map
The generated map with marked launch sites should look similar to the following:
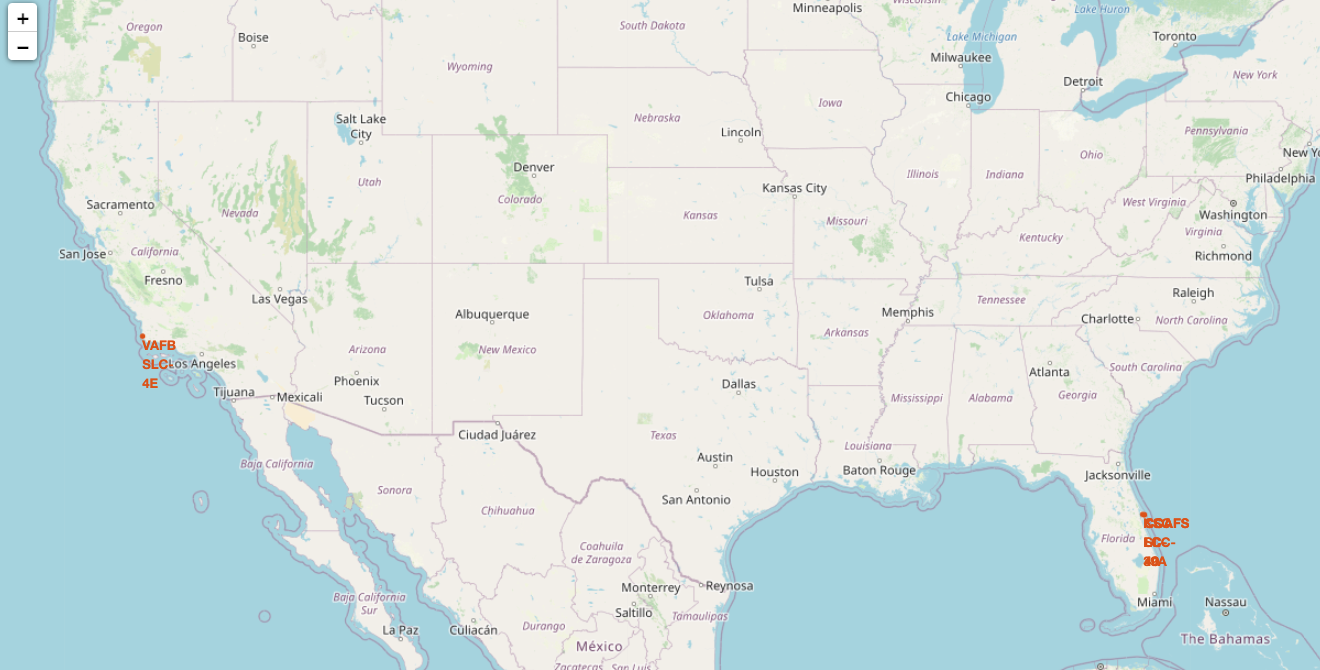
Now, you can explore the map by zoom-in/out the marked areas , and try to answer the following questions:
- Are all launch sites in proximity to the Equator line?
- Are all launch sites in very close proximity to the coast?
Also please try to explain your findings.
Task 2: Mark the success/failed launches for each site on the map
Next, let’s try to enhance the map by adding the launch outcomes for each site, and see which sites have high success rates.
Recall that data frame spacex_df has detailed launch records, and the class column indicates if this launch was successful or not
spacex_df.tail(10)
| LaunchSite | Latitude | Longitude | Class | |
|---|---|---|---|---|
| 80 | CCSFS SLC 40 | 28.561857 | -80.577366 | 1 |
| 81 | CCSFS SLC 40 | 28.561857 | -80.577366 | 1 |
| 82 | CCSFS SLC 40 | 28.561857 | -80.577366 | 1 |
| 83 | CCSFS SLC 40 | 28.561857 | -80.577366 | 1 |
| 84 | CCSFS SLC 40 | 28.561857 | -80.577366 | 1 |
| 85 | KSC LC 39A | 28.608058 | -80.603956 | 1 |
| 86 | KSC LC 39A | 28.608058 | -80.603956 | 1 |
| 87 | KSC LC 39A | 28.608058 | -80.603956 | 1 |
| 88 | CCSFS SLC 40 | 28.561857 | -80.577366 | 1 |
| 89 | CCSFS SLC 40 | 28.561857 | -80.577366 | 1 |
Next, let’s create markers for all launch records.
If a launch was successful (class=1), then we use a green marker and if a launch was failed, we use a red marker (class=0)
Note that a launch only happens in one of the four launch sites, which means many launch records will have the exact same coordinate. Marker clusters can be a good way to simplify a map containing many markers having the same coordinate.
Let’s first create a MarkerCluster object
marker_cluster = MarkerCluster()
TODO: Create a new column in 1 dataframe called marker_color to store the marker colors based on the class value
# Apply a function to check the value of `class` column
# If class=1, marker_color value will be green
# If class=0, marker_color value will be red
# Function to assign color to launch outcome
def assign_marker_color(launch_outcome):
    if launch_outcome == 1:
        return 'green'
    else:
        return 'red'

spacex_df['marker_color'] = spacex_df['Class'].apply(assign_marker_color)
spacex_df.head(10)
| LaunchSite | Latitude | Longitude | Class | marker_color | |
|---|---|---|---|---|---|
| 0 | CCSFS SLC 40 | 28.561857 | -80.577366 | 0 | red |
| 1 | CCSFS SLC 40 | 28.561857 | -80.577366 | 0 | red |
| 2 | CCSFS SLC 40 | 28.561857 | -80.577366 | 0 | red |
| 3 | VAFB SLC 4E | 34.632093 | -120.610829 | 0 | red |
| 4 | CCSFS SLC 40 | 28.561857 | -80.577366 | 0 | red |
| 5 | CCSFS SLC 40 | 28.561857 | -80.577366 | 0 | red |
| 6 | CCSFS SLC 40 | 28.561857 | -80.577366 | 1 | green |
| 7 | CCSFS SLC 40 | 28.561857 | -80.577366 | 1 | green |
| 8 | CCSFS SLC 40 | 28.561857 | -80.577366 | 0 | red |
| 9 | CCSFS SLC 40 | 28.561857 | -80.577366 | 0 | red |
TODO: For each launch result in spacex_df data frame, add a folium.Marker to marker_cluster
# Add marker_cluster to current site_map
site_map.add_child(marker_cluster)

# for each row in spacex_df data frame
# create a Marker object with its coordinate
# and customize the Marker's icon property to indicate if this launch was successed or failed,
# e.g., icon=folium.Icon(color='white', icon_color=row['marker_color']
for index, record in spacex_df.iterrows():
    coordinate = [record["Latitude"], record["Longitude"]]#coordinate = [record["Lat"], record["Long"]]
    launchSite = record["LaunchSite"]#launchSite = record["Launch Site"]
    # TODO: Create and add a Marker cluster to the site map
    # marker = folium.Marker(...)
    marker = folium.map.Marker(
        coordinate,
        icon=folium.Icon(
            color='white',
            icon_color=record['marker_color']
        )
    )#.add_to(site_map)
    marker_cluster.add_child(marker)

site_map
Your updated map may look like the following screenshots:
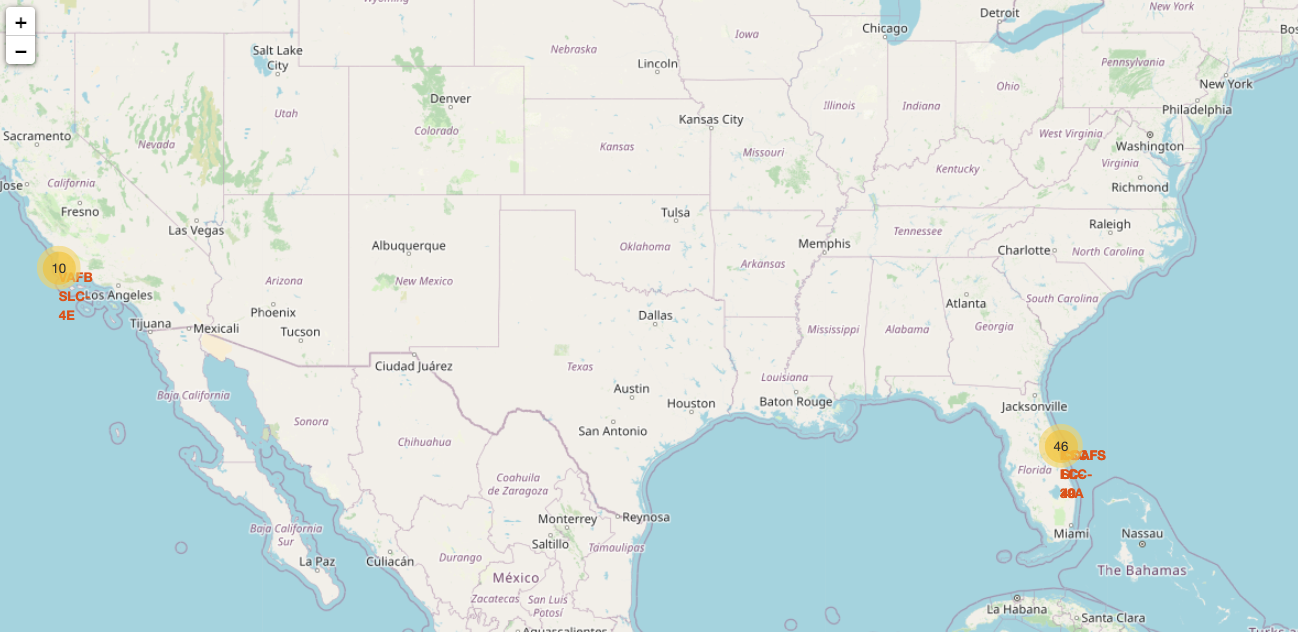
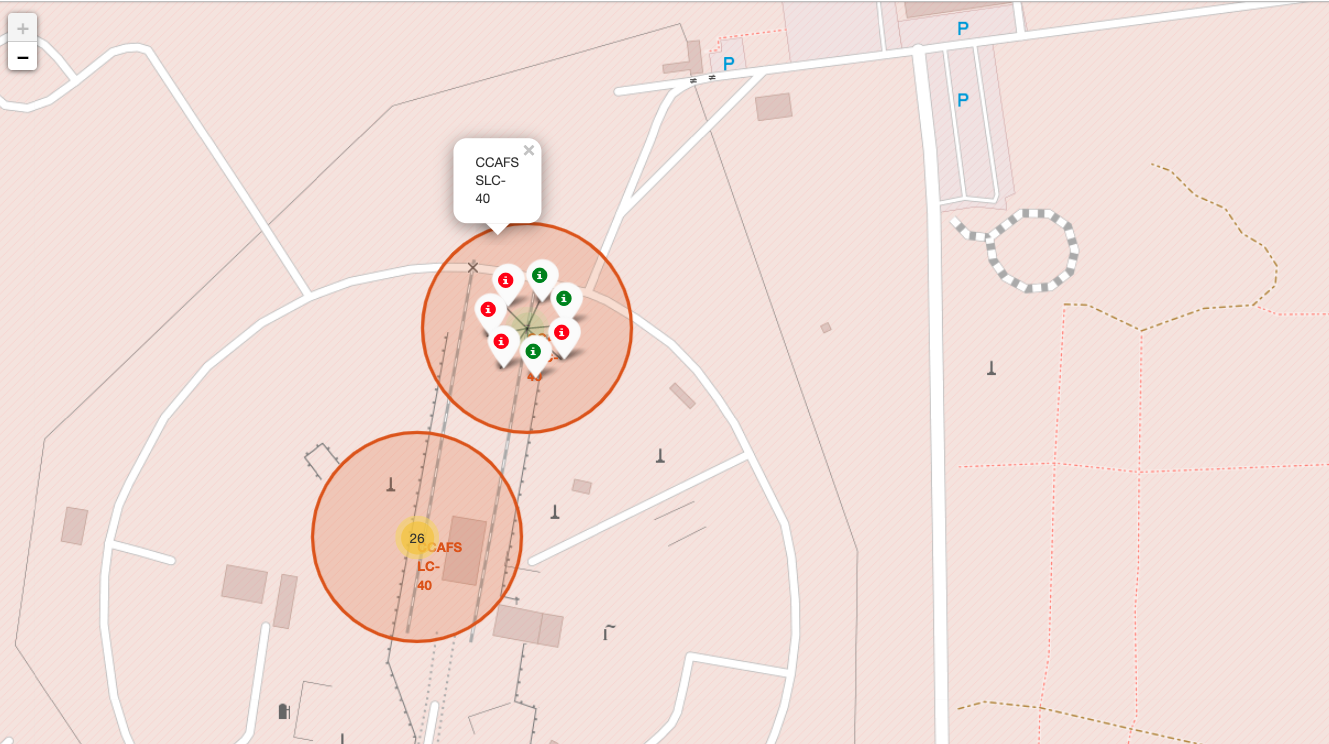
From the color-labeled markers in marker clusters, you should be able to easily identify which launch sites have relatively high success rates.
TASK 3: Calculate the distances between a launch site to its proximities
Next, we need to explore and analyze the proximities of launch sites.
Let’s first add a MousePosition on the map to get coordinate for a mouse over a point on the map. As such, while you are exploring the map, you can easily find the coordinates of any points of interests (such as railway)
# Add Mouse Position to get the coordinate (Lat, Long) for a mouse over on the map
formatter = "function(num) {return L.Util.formatNum(num, 5);};"
mouse_position = MousePosition(
    position='topright',
    separator=' Long: ',
    empty_string='NaN',
    lng_first=False,
    num_digits=20,
    prefix='Lat:',
    lat_formatter=formatter,
    lng_formatter=formatter,
)

site_map.add_child(mouse_position)
site_map
Now zoom in to a launch site and explore its proximity to see if you can easily find any railway, highway, coastline, etc. Move your mouse to these points and mark down their coordinates (shown on the top-left) in order to the distance to the launch site.
You can calculate the distance between two points on the map based on their Lat and Long values using the following method:
from math import sin, cos, sqrt, atan2, radians

def calculate_distance(lat1, lon1, lat2, lon2):
    # approximate radius of earth in km
    R = 6373.0

    lat1 = radians(lat1)
    lon1 = radians(lon1)
    lat2 = radians(lat2)
    lon2 = radians(lon2)

    dlon = lon2 - lon1
    dlat = lat2 - lat1

    a = sin(dlat / 2)**2 + cos(lat1) * cos(lat2) * sin(dlon / 2)**2
    c = 2 * atan2(sqrt(a), sqrt(1 - a))

    distance = R * c
    return distance
TODO: Mark down a point on the closest coastline using MousePosition and calculate the distance between the coastline point and the launch site.
# find coordinate of the closet coastline
# e.g.,: Lat: 28.56367  Lon: -80.57163
launch_site_lat = launch_sites_df.iloc[2]["Latitude"]
launch_site_lon = launch_sites_df.iloc[2]["Longitude"]
lat_coastline = 34.63617
long_coastline = -120.62503
distance_coastline = calculate_distance(launch_site_lat, launch_site_lon, lat_coastline, long_coastline)
print(distance_coastline)
print(launch_site_lat)
print(launch_site_lon)
1.3765145755131973
34.632093
-120.610829
TODO: After obtained its coordinate, create a folium.Marker to show the distance
# Create and add a folium.Marker on your selected closest coastline point on the map
# Display the distance between coastline point and launch site using the icon property
# for example
coordinate = [lat_coastline, long_coastline]

distance_coastline_marker = folium.Marker(
    coordinate,
    icon=DivIcon(
        icon_size=(20,20),
        icon_anchor=(0,0),
        html='<div style="font-size: 12; color:#d35400;"><b>%s</b></div>' % "{:10.2f} KM".format(distance_coastline),
        )
    )
site_map.add_child(distance_coastline_marker)
TODO: Draw a PolyLine between a launch site to the selected coastline point
# Create a `folium.PolyLine` object using the coastline coordinates and launch site coordinate
points = []
points.append([launch_site_lat, launch_site_lon])
points.append([lat_coastline, long_coastline])
lines=folium.PolyLine(locations=points, weight=1)
site_map.add_child(lines)
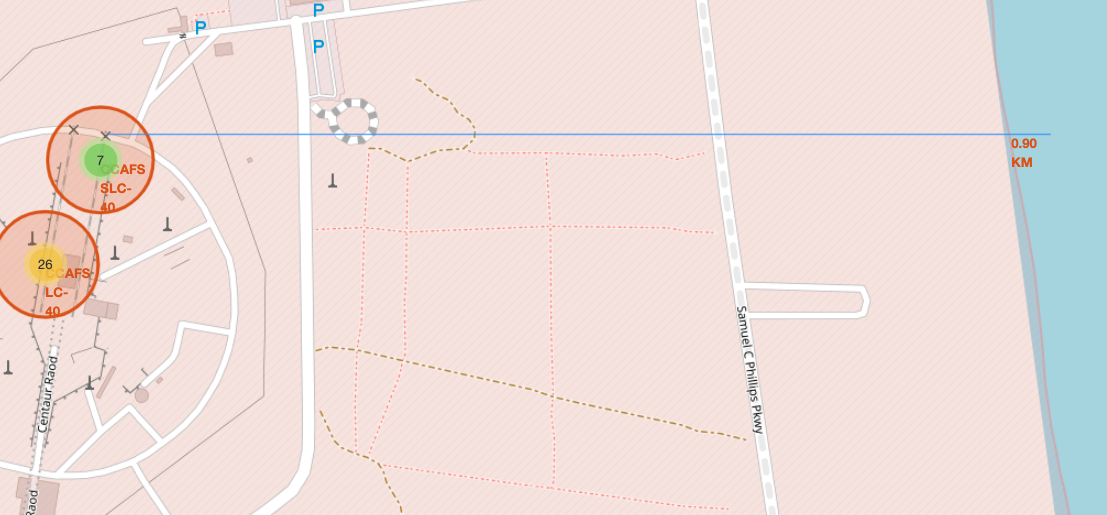
Your updated map with distance line should look like the following screenshot:
TODO: Similarly, you can draw a line betwee a launch site to its closest city, railway, highway, etc. You need to use MousePosition to find the their coordinates on the map first
A railway map symbol may look like this:
A highway map symbol may look like this:
A city map symbol may look like this:
# Create a marker with distance to a closest city, railway, highway, etc.
# Draw a line between the marker to the launch site
# find coordinate of the closet city
# e.g.,: Lat: 28.56367  Lon: -80.57163
launch_site_lat = launch_sites_df.iloc[2]["Latitude"]
launch_site_lon = launch_sites_df.iloc[2]["Longitude"]
lat_city = 33.91
long_city = -118.19
distance_city = calculate_distance(launch_site_lat, launch_site_lon, lat_city, long_city)
print(distance_city)
print(launch_site_lat)
print(launch_site_lon)
236.5623564063504
34.632093
-120.610829
# Create and add a folium.Marker on your selected closest city point on the map
# Display the distance between city point and launch site using the icon property
# for example
coordinate = [lat_city, long_city]

distance_city_marker = folium.Marker(
    coordinate,
    icon=DivIcon(
        icon_size=(20,20),
        icon_anchor=(0,0),
        html='<div style="font-size: 12; color:#d35400;"><b>%s</b></div>' % "{:10.2f} KM".format(distance_city),
        )
    )
site_map.add_child(distance_city_marker)
# Create a `folium.PolyLine` object using the city coordinates and launch site coordinate
points = []
points.append([launch_site_lat, launch_site_lon])
points.append([lat_city, long_city])
lines=folium.PolyLine(locations=points, weight=1)
site_map.add_child(lines)
After you plot distance lines to the proximities, you can answer the following questions easily:
- Are launch sites in close proximity to railways?
- Are launch sites in close proximity to highways?
- Are launch sites in close proximity to coastline?
- Do launch sites keep certain distance away from cities?
Also please try to explain your findings.
Next Steps:
Now you have discovered many interesting insights related to the launch sites’ location using folium, in a very interactive way. Next, you will need to build a dashboard using Ploty Dash on detailed launch records.
Authors
Other Contributors
Joseph Santarcangelo
Change Log
| Date (YYYY-MM-DD) | Version | Changed By | Change Description |
|---|---|---|---|
| 2021-05-26 | 1.0 | Yan | Created the initial version |
Copyright © 2021 IBM Corporation. All rights reserved.