I’m going to analyze the dataset of the Groningen dogs owners to see who are they - people who owns the dog in Groningen?
Let’s take a look at the data I collect and prepared, so maybe there are any correlations and relationships between different factors.
import pandas as pd
import numpy as np
import matplotlib.pyplot as plt
import seaborn as sns

data = pd.read_csv("population_clean_data.csv")

print(data.columns)
data.head()
Index(['buurtcode', 'buurtnaam', 'wijkcode', 'inwoners_per_km2',
       'perc_0_15_jaar', 'perc_15_25_jaar', 'perc_25_45_jaar',
       'perc_45_65_jaar', 'perc_65_en_ouder', 'perc_ongehuwd', 'perc_gehuwd',
       'perc_gescheid', 'perc_verweduwd', 'aantal_huishoudens',
       'perc_eenpersoonshuishoudens', 'perc_huishoudens_z_kind',
       'perc_huishoudens_met_kind', 'gemiddelde_huishoudsgrootte',
       'perc_west_migratie', 'perc_niet_west_migratie',
       'percentage_uit_marokko', 'perc_uit_antillen_en_aruba',
       'percentage_uit_suriname', 'percentage_uit_turkije',
       'perc_overige_nietwestersemigratie', 'bedrijven_landbouw',
       'gemid_won_waarde', 'perc_eengezinswoning', 'perc_meergezinswoning',
       'perc_koopwoningen', 'perc_huurwoningen',
       'perc_huurwoning_van_corporaties', 'perc_huurwoning_van_verhuurder',
       'perc_werknemers', 'perc_zelfstandigen',
       'gemiddeld_inkomen_per_inwoner', 'perc_huishoud_laag_inkomen',
       'perc_huishoud_hoog_inkomen', 'personen_met_bijstandsuitkering',
       'gewelds_misdrijven', 'autos_totaal', 'autos_per_huishouden',
       'motortweewielers', 'bevolking_totaal', 'percentage_minimahuishoudens',
       'aantal_minimahuishoudens', 'gemiddeld_huishoudensinkomen',
       'diefstal_af_uit_woning', 'diefstal_auto', 'diefstal_fiets',
       'diefstal_af_uit_bedrijf', 'diefstal_af_uit_auto',
       'aangiften_van_vernieling', 'aangiften_van_mishandeling', 'dogs_amount',
       'politie_report_aantal'],
      dtype='object')
| buurtcode | buurtnaam | wijkcode | inwoners_per_km2 | perc_0_15_jaar | perc_15_25_jaar | perc_25_45_jaar | perc_45_65_jaar | perc_65_en_ouder | perc_ongehuwd | ... | gemiddeld_huishoudensinkomen | diefstal_af_uit_woning | diefstal_auto | diefstal_fiets | diefstal_af_uit_bedrijf | diefstal_af_uit_auto | aangiften_van_vernieling | aangiften_van_mishandeling | dogs_amount | politie_report_aantal | |
|---|---|---|---|---|---|---|---|---|---|---|---|---|---|---|---|---|---|---|---|---|---|
| 0 | BU000000 | Binnenstad-Noord | WK001400 | 11891.0 | 2.0 | 46.0 | 35.0 | 11.0 | 6.0 | 86.0 | ... | 30.0 | 25.0 | 1.0 | 176.0 | 17.0 | 8.0 | 25.0 | 35.0 | 37 | 287.0 |
| 1 | BU000001 | Binnenstad-Zuid | WK001400 | 12011.0 | 2.0 | 47.0 | 33.0 | 11.0 | 6.0 | 87.0 | ... | 30.7 | 42.0 | 3.0 | 306.0 | 28.0 | 30.0 | 96.0 | 196.0 | 51 | 701.0 |
| 2 | BU000002 | Binnenstad-Oost | WK001400 | 14979.0 | 3.0 | 40.0 | 36.0 | 14.0 | 7.0 | 84.0 | ... | 27.8 | 17.0 | 1.0 | 56.0 | 2.0 | 3.0 | 16.0 | 8.0 | 48 | 103.0 |
| 3 | BU000003 | Binnenstad-West | WK001400 | 17507.0 | 2.0 | 38.0 | 40.0 | 11.0 | 9.0 | 84.0 | ... | 29.7 | 9.0 | 0.0 | 13.0 | 2.0 | 4.0 | 8.0 | 5.0 | 21 | 41.0 |
| 4 | BU000005 | Hortusbuurt-Ebbingekwartier | WK001400 | 12509.0 | 5.0 | 41.0 | 30.0 | 15.0 | 9.0 | 82.0 | ... | 32.1 | 20.0 | 2.0 | 68.0 | 16.0 | 9.0 | 24.0 | 13.0 | 108 | 152.0 |
5 rows × 56 columns
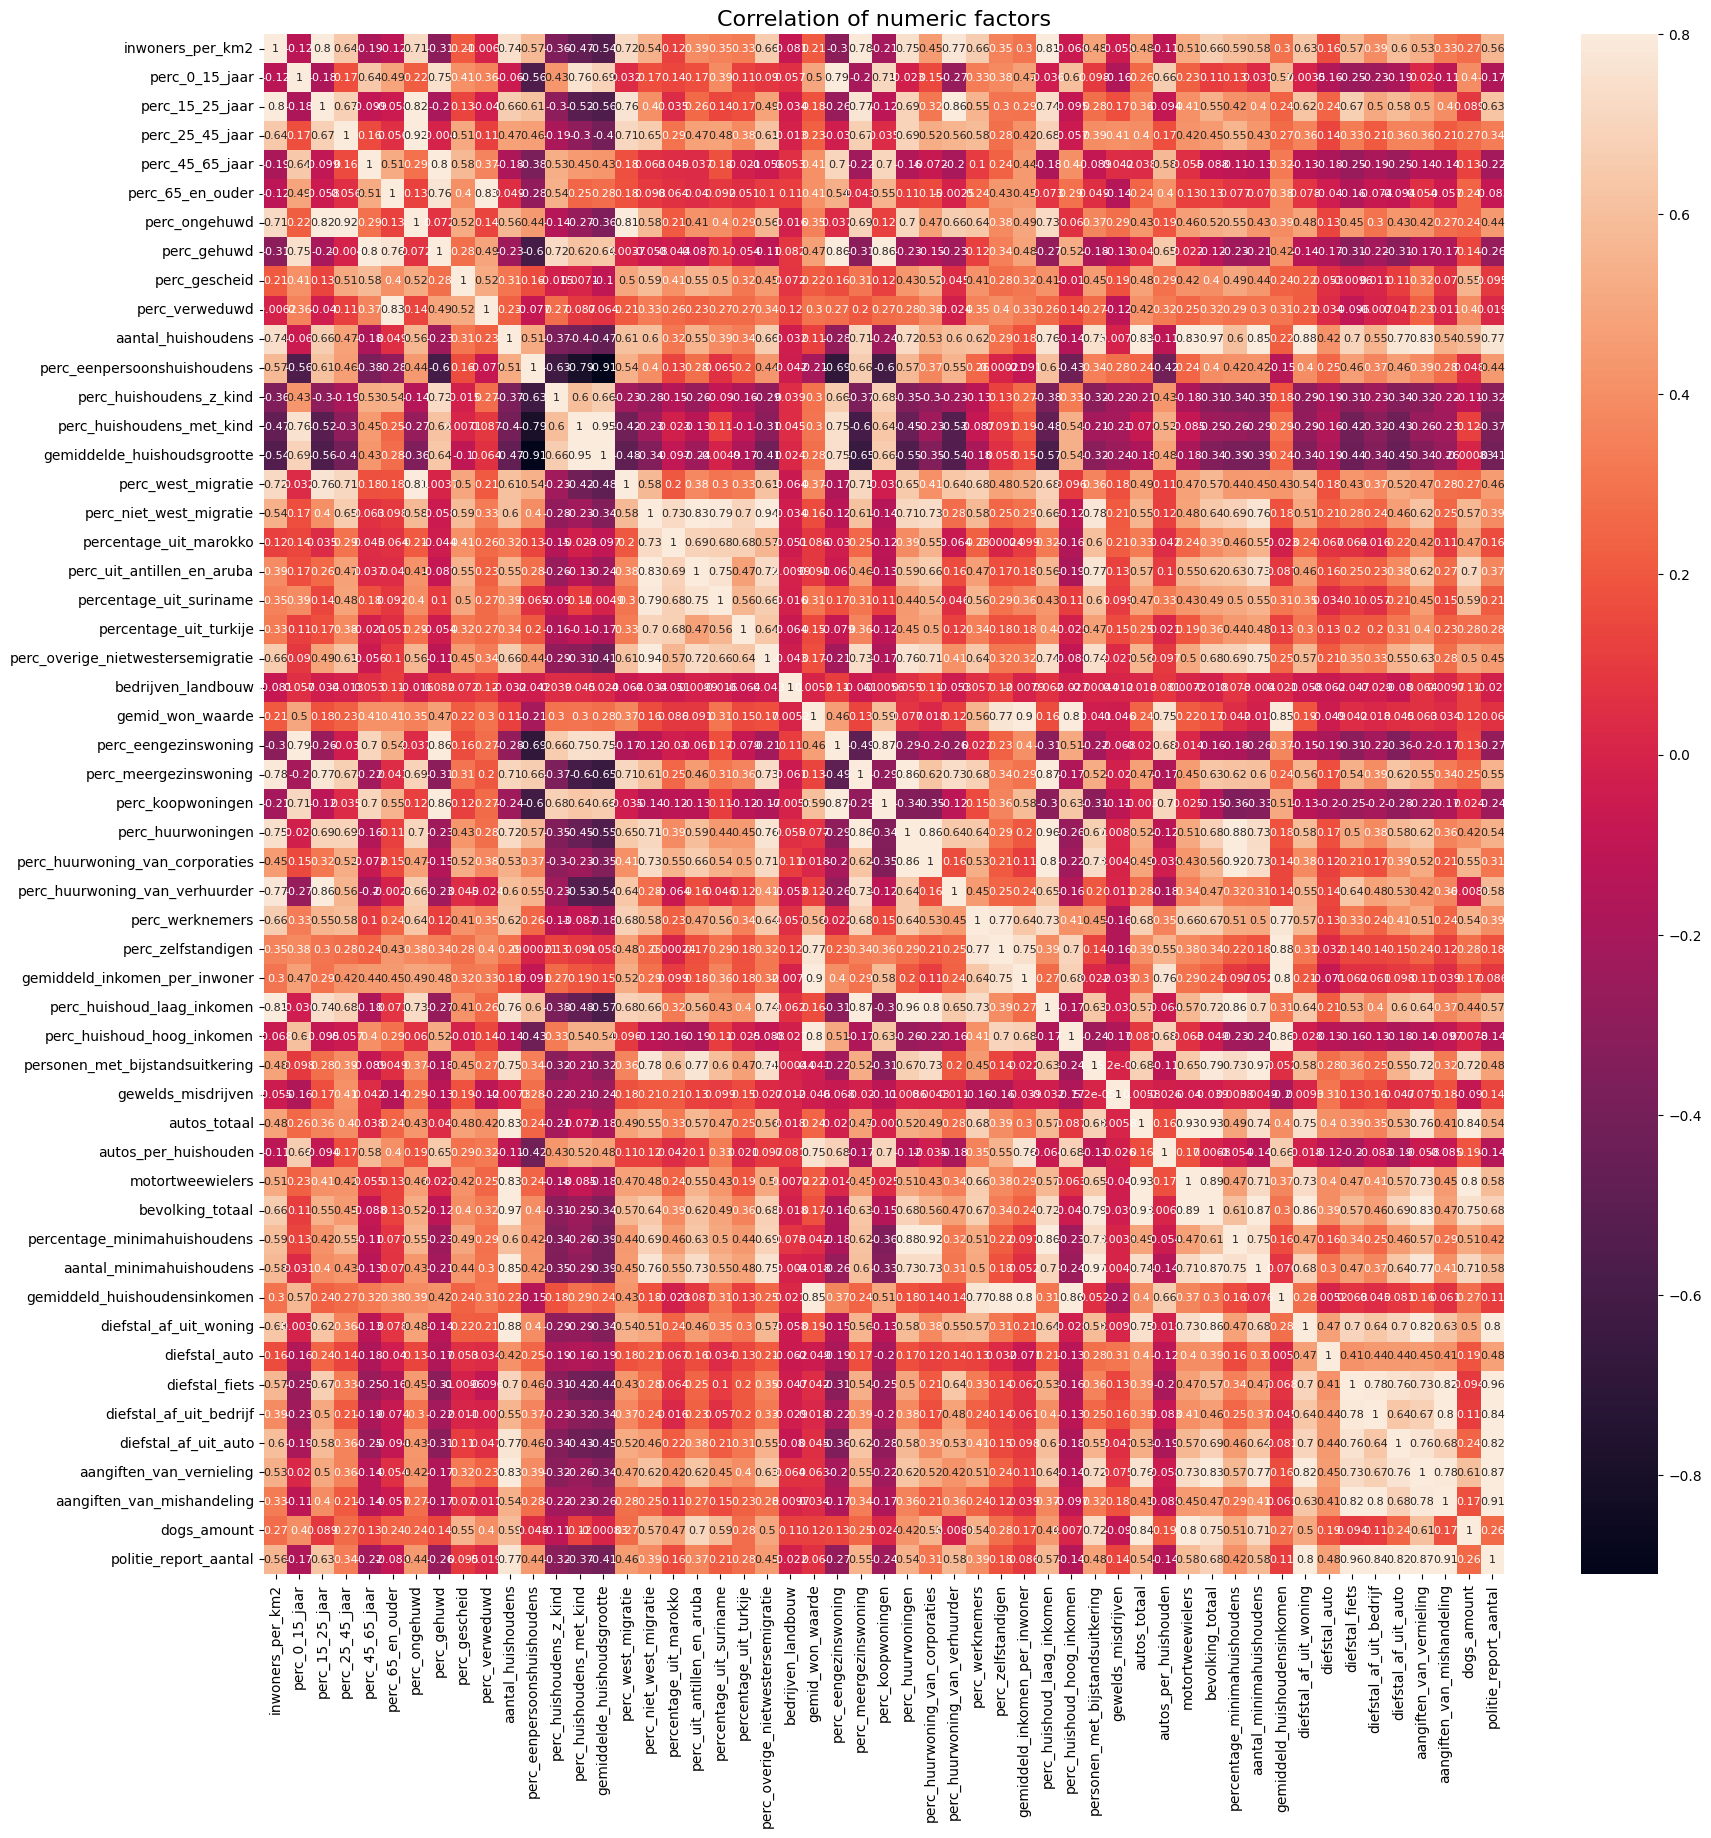
First I’m going to get numeric columns and see the correlation matrix (but )
numeric_data = data.select_dtypes(include=[np.number])

corr_matrix = numeric_data.corr()
f, ax = plt.subplots(figsize = (20,20))
plt.title('Correlation of numeric factors', y = 1, size = 16)
sns.heatmap(corr_matrix, vmax = .8, annot_kws={'size': 8}, annot = True)
<AxesSubplot: title={'center': 'Correlation of numeric factors'}>

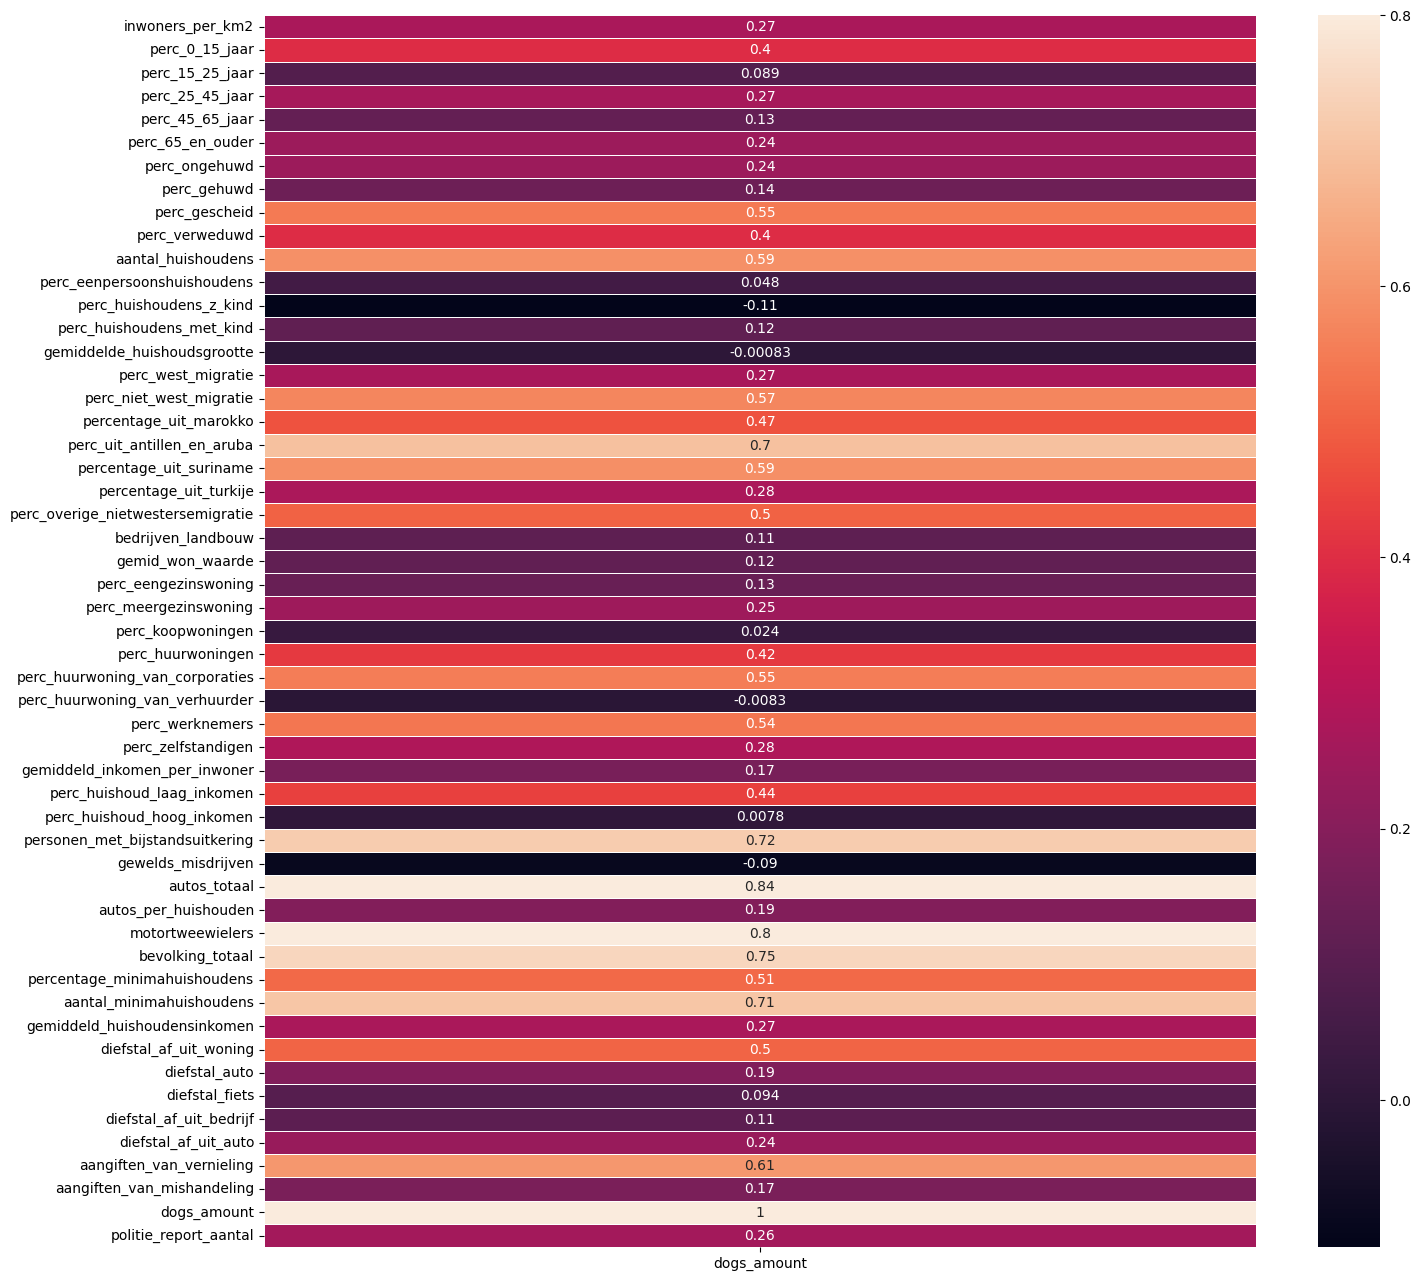
Looking at the picture of the correlation matrix (above) I can say that there are definately some correlations there, but because there are a lot of factors and poor readability of the matrix, it’s difficult to say anything spetial, so let’s take a closer look. We are interested in the dog’s owners, so I will take a dogs_amount column and show it’s correlation with other factors:
dogs_amount = corr_matrix[['dogs_amount']]
fig, ax = plt.subplots(figsize=(16, 16))
ax = sns.heatmap(dogs_amount, vmax = .8, annot_kws={'size': 10}, annot = True, linewidths=.5)

Now let’s get only strong correlated columns:
corr_values = [row for row in dogs_amount.items()][0][1]
columns = [column for column in numeric_data.columns if corr_values[column] > 0.6]
sns.pairplot(data = data,
             x_vars = ['dogs_amount'],
             y_vars = columns)
<seaborn.axisgrid.PairGrid at 0x13fbb8f90>

for column in columns:
    print(column + ": " + str(corr_values[column]))
perc_uit_antillen_en_aruba: 0.7000535645951397
personen_met_bijstandsuitkering: 0.722981338084339
autos_totaal: 0.8369100868143818
motortweewielers: 0.796743835950187
bevolking_totaal: 0.7475149616129847
aantal_minimahuishoudens: 0.709500199839632
aangiften_van_vernieling: 0.6056959022366318
dogs_amount: 1.0
As an answer to the question: “Who owns a dog in Groningen?” we can see from the charts above, most of the dog’s owners in Groningen have a car or two wheelers motorcycle, receive some welfare benefits and probably live in the area where they would experience destruction from other people more than in other places. Also I can see that probably people, who moved to the Netherlands from Netherlands Antilles and Aruba love dogs and have it at home more often them other people.